This page is for top level interrogation of all activity data.
- From the home page click on the View Data icon:
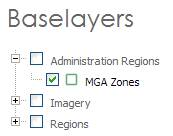
- Select the Baselayers you would like to display in the Table of Contents.
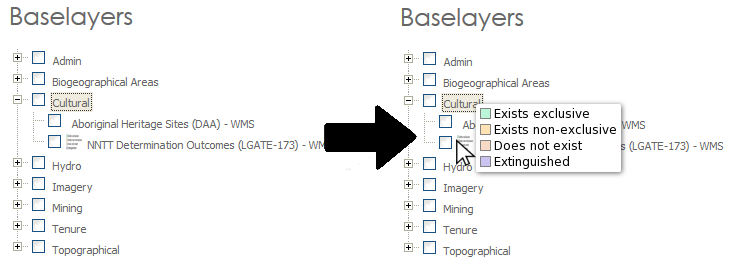
Legend graphics (where available from the publisher) can now be viewed from WMS layers. Simply hover your cursor over the Baselayer in the menu and the legend will appear. For example, in the below image the WMS layer ‘NNTT Determination Outcomes’ is being hovered over.
- Use the navigation tools in the interactive map to navigate to an area where you would like to view activities:
-
 Pan Map.
 -
 Show Full Screen.
 -
 Zoom In and
  Zoom Out.
-
- You can also click and hold on the map to pan and use the scroll wheel to zoom in and out.
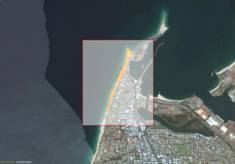
- Hold the Shift key down and click to drag a zoom square over your area of interest:
- Enter specific coordinates of a known area:
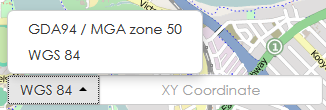
- Select your preferred CRS from the menu (located at the bottom of the map):
- Click in the XY Coordinate
- Type your coordinates and press ENTER.
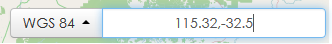
NOTE: The zoom extent will not change from its current extent. The map will pan to the specified coordinates.
- Select your preferred CRS from the menu (located at the bottom of the map):
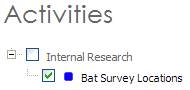
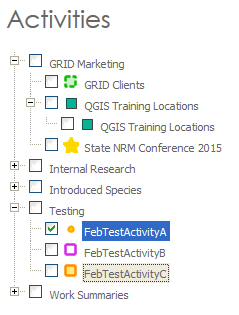
- Select the activities you would like to view in the interactive map by checking them in the Table of Contents:
- For an existing Activity you can double click on the activity in the menu and the map will zoom to that layer extent.
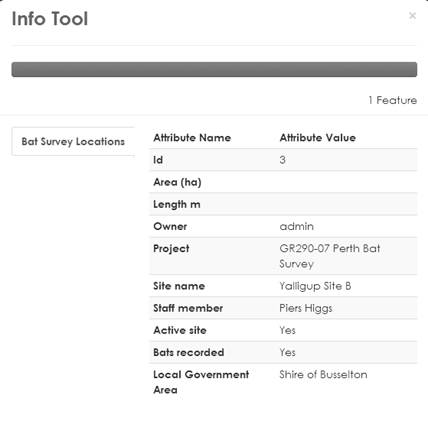
- Interrogate the activity features using the Info
 tool.
tool. - A dialog box will appear showing the features attributes:
- If you select multiple features at a time, a dialog box will appear with all features tabulated to the left of the dialog box.
- Clicking on a tab will also highlight the feature blue in the map viewer so it can be easily located.