GRID provides functionality to upload one band rasters (i.e. rainfall) or multiband (i.e. images) in GeoTiff format.
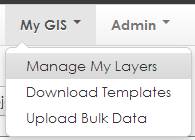
- Click on Manage My Layers from the MY GIS menu:
- Click on Add Layer.
- Choose GeoTIFF from the list of tabs:

- Complete the following fields:
- Name: The name for the data you want to see in GRID (i.e. Rainfall)
- Category: How you want the data to be categorised in GRID (i.e. Climate Change)
- Order: The order you would like the layers to display in the table of contents under the category specified
- Data File: Click the Browse button and navigate to your .tif file and click OK.
Your .tif file name must not contain spaces (i.e. “Delta_Rainfall.tif” not “Delta Rainfall.tif”) or special characters (i.e. ~!@#$%^&*()+{}|:”<>?`[]\;’,./)Ensure all data loaded into My Layers have unique names
- Min Scale (optional): The minimum scale that you wish your data to display on the map
- Max Scale (optional): The maximum scale that you wish your data to display on the map
- Layer Access: In Activity and Base Layers, Layer Access defines the levels of user who can see the data. As this option does not have any implications in the User Layers, it can be left as the default of internal (see 6.12 Internal, External and Public permission levels)
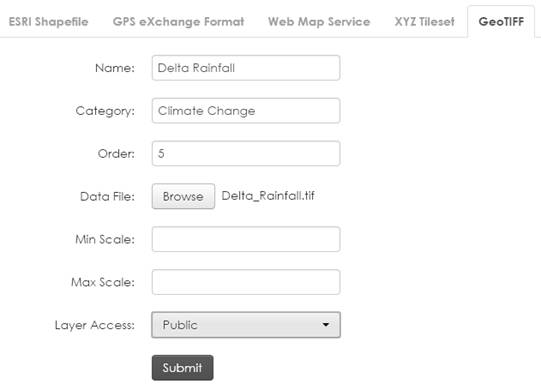
- Click Submit.
- Once successfully uploaded you will receive feedback:

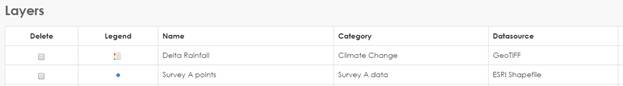
- The uploaded layer will display in the Layers table (most recently uploaded showing first):
- The layer is given default symbology, to change click Edit Symbology.
- From this page you can change the colour ramp, opacity and number of classes (Symbology options change with type of GeoTIFF uploaded – i.e. some GeoTIFFs can have pre-set colours. No symbology is available for multiband rasters such as images):
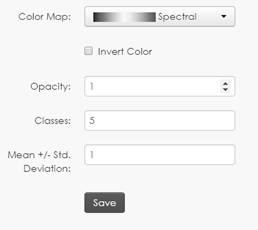
- Click Save when finished with symbology.
- To edit the layer properties (i.e. display order, source data or min/ max scale), click Edit Layer under the Actions column.
- To delete a layer, tick the delete checkbox next to a row and click Delete Layer.
- If your layer isn’t listed in the Layers table, click on a different page

- or Search for it by its name:
- To view your added layers, in the Menu Bar go to Home.
- Click Add & Edit Data.
- Scroll down the page until you see User Layers.
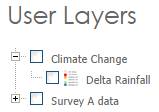
- You can hover over the legend to enlarge it.
- You can check and uncheck layers as usual to view them in the map display.
- To edit your layers, in the Menu Bar go back to My GIS > Manage My Layers and click Edit Layer or Edit Symbology.